Emoji Use in the New Normal

A sentiment analysis performed by Emojipedia finds that positive emoji use is on the decrease, while the total number of emojis sent in our communications continues to rise.
Analyzing 68 million unique tweets, a number of patterns have emerged which go some way toward reflecting the global mood and how we communicate in the “new normal” of 2020.
😄😫📊 Emoji Sentiment
By grouping “smiley” emojis – generally classed as the non-human yellow balls of emotion – into positive and negative categories, we can assess various sentiment trends on Twitter.
Of all the available emojis, smileys tend to be most used to convey emotion, and are most useful for this style of sentiment analysis. They're also the most popular type of emoji sent, according to Unicode statistics.
Isolating instances[1] of smileys and charting the relative size of their emotional polarity ("Positive", "Negative" or "Other/Ambiguous")[2] allows a look at emotional trends on Twitter, when it comes to emoji use.
Charted below are these three groups of smileys, shown as a percentage of all individual emoji instances during four selected time frames between August 2018 and April 2020.[3].
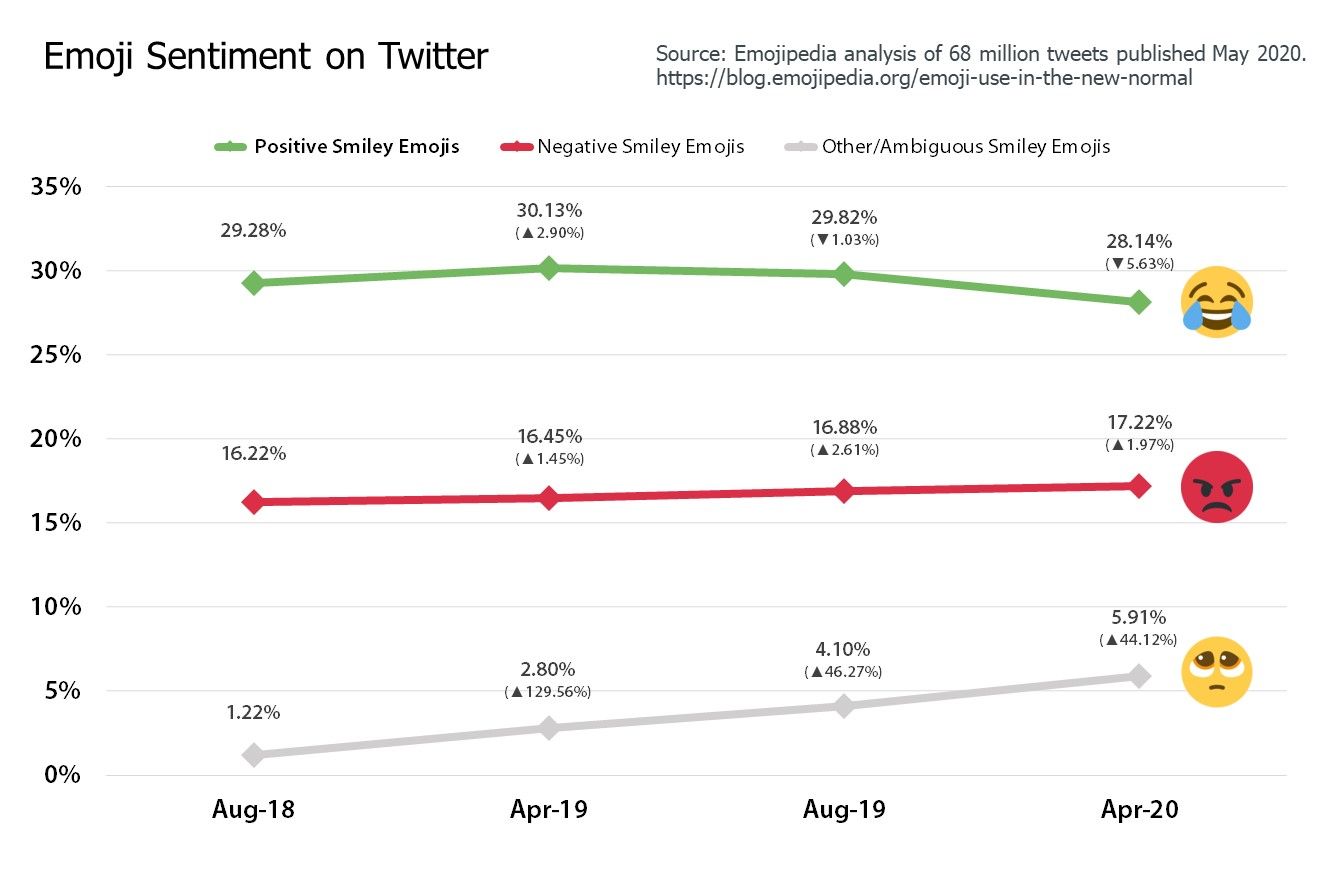
Above: The relative use of positive emojis is down, while negative emojis have seen a slight increase.
Between August 2019 and April 2020 the percentage of all individual positive smiley instances decreased from 29.92% to 28.12% - a relative decrease of 5.63%.
What this data also shows is that positive expressions remain the most popular type of smiley. These never dropped below 28% of all emoji instances throughout the period measured.
While it's impossible to determine all reasons behind any sentiment shift, this change could be a result of fewer positive tweets due to the current global pandemic, especially as the largest relative drop was seen in the most recent period.
There is a considerable jump in the number of "Other/Ambiguous" instances, which is accounted for by rapid ascent of the popular and variable 🥺 Pleading Face. This relative newcomer has ended up as the third most popular emoji on Twitter.
Relative to all smileys sent, negative emoji use continues to show a steady climb year-on-year. This a trend which continues year on year.
🔝🔟 Top Ten Emojis
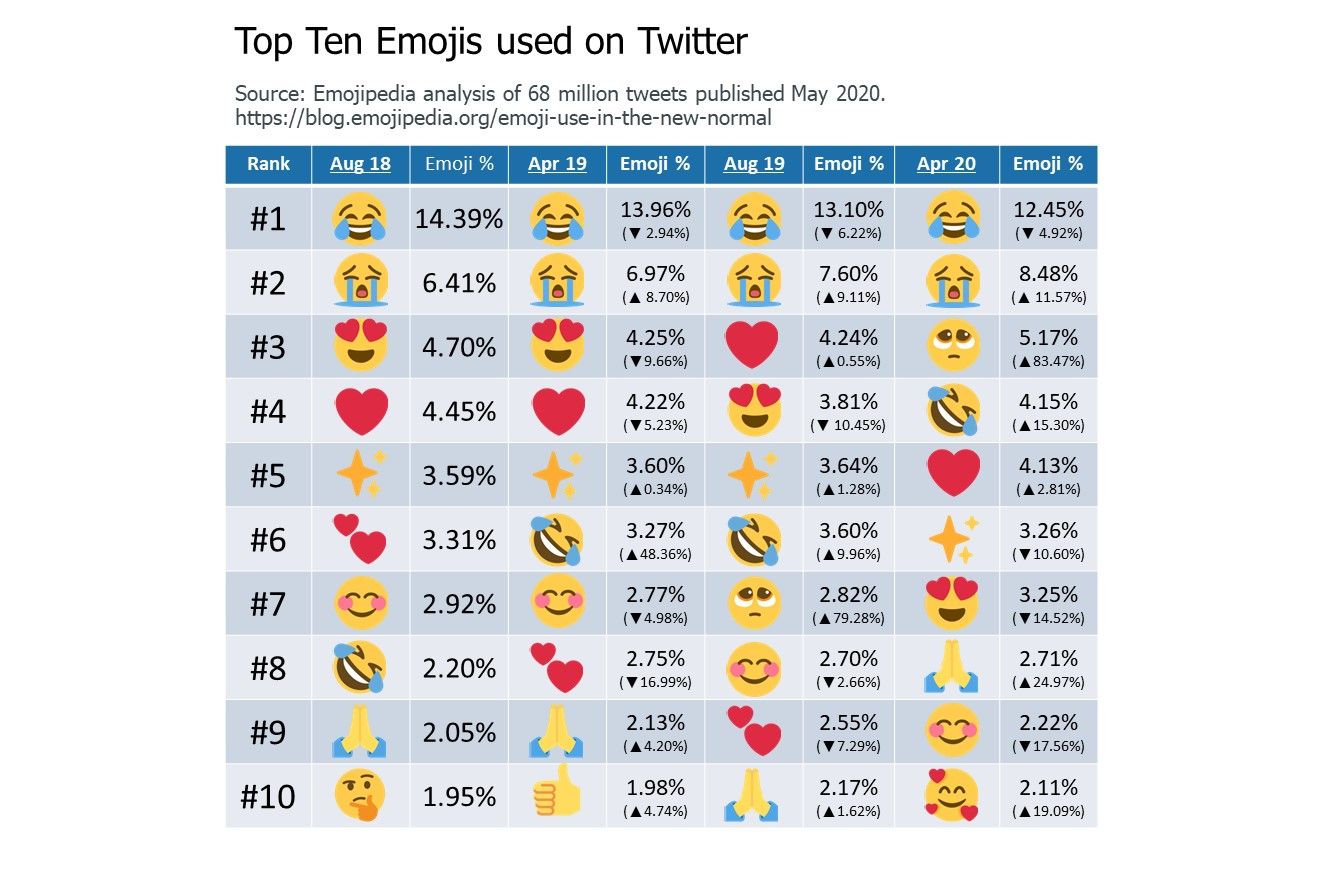
A total of thirteen different emojis appeared at least once in the analysis of the top ten emojis found over the four timeframes assessed.
This shows a relatively stable level of popularity for those emojis most often used by Twitter users. People are known to be creatures of habit after all.
The top thirteen emojis, ordered by their relative rank in our sample from April 2020[4]:
- 😂 Face with Tears of Joy
- 😭 Loudly Crying Face
- 🥺 Pleading Face
- 🤣 Rolling on the Floor Laughing
- ❤️ Red Heart
- ✨ Sparkles
- 😍 Smiling Face with Heart-Eyes
- 🙏 Folded Hands
- 😊 Smiling Face with Smiling Eyes
- 🥰 Smiling Face with Hearts
- 👍 Thumbs Up
- 💕 Two Hearts
- 🤔 Thinking Face
Across all four time frames, the 😂 Face with Tears of Joy was firmly in first place, followed somewhat distantly by the 😭 Loudly Crying Face.
Movement among 😍 Smiling Face with Heart-Eyes, 😊 Smiling Face with Smiling Eyes and 🥰 Smiling Face with Hearts seen in April 2020 is of note: each express affection, so it is possible the relatively new 🥰 Smiling Face with Hearts is appearing in tweets where either 😍 Smiling Face with Heart-Eyes, 😊 Smiling Face with Smiling Eyes would have previously appeared.
Note that in the chart above we describe the percentages for each emoji in each time frame[5] as "Emoji %". This is the percentage of tweets featuring at least one emoji that the specific emoji appeared in.
🙏 Folded Hands saw nearly a 25% increase between August 2019 and April 2020, which could be related to our current circumstances. No it's not a high-five.
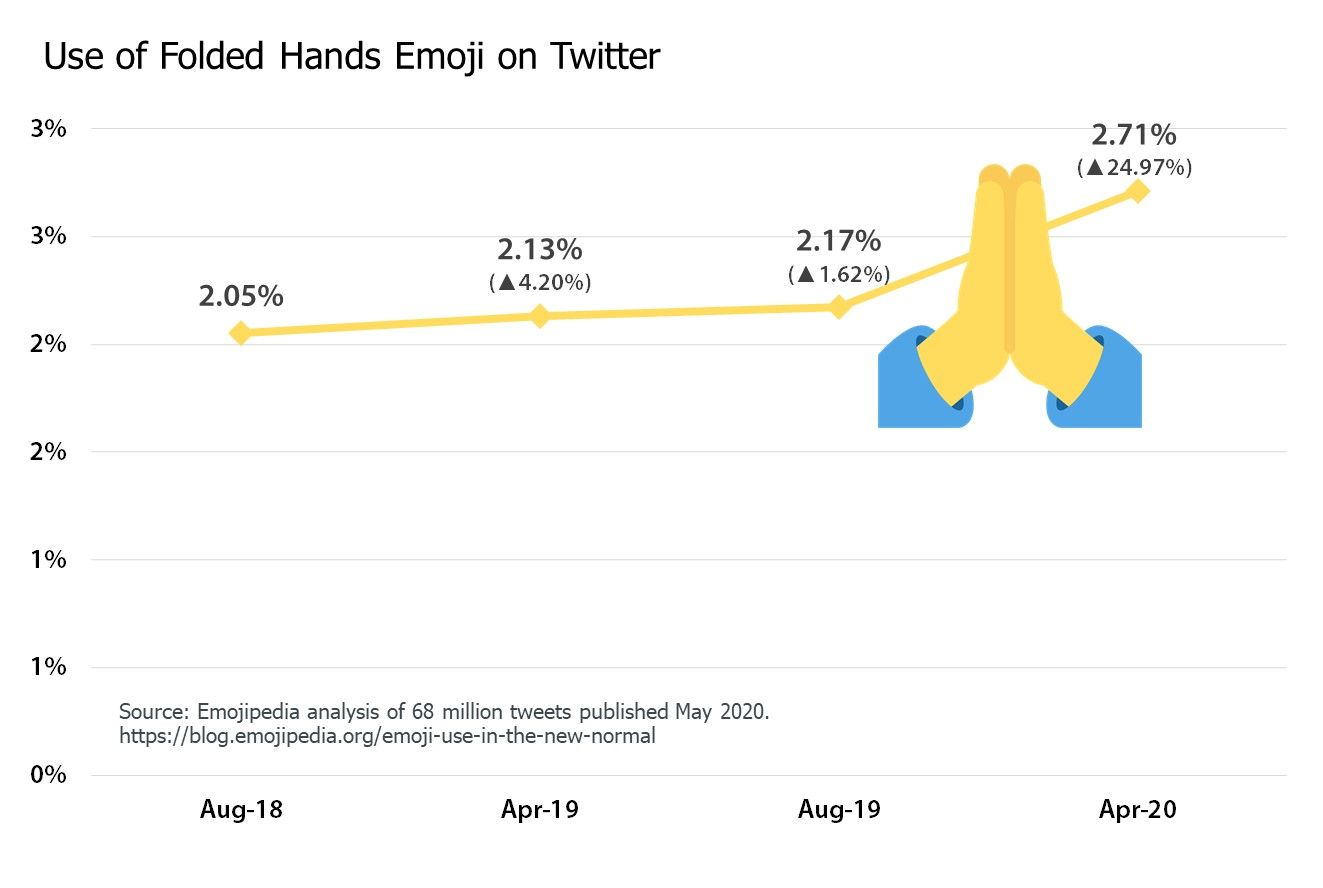
Above: Use of 🙏 Folded Hands has increased.
📈📉📈 Total Emoji Usage
A common question right now is whether our global shift to working-from-home has resulted in more emoji use. Emojipedia itself has seen high growth recently, but does that mean more emojis are being used overall?
Based on our analysis of 68 million tweets, the answer is a resounding yes: emoji use is up. The most recent period assessed shows nearly one in five (19.04%) of tweets contains at least one emoji.
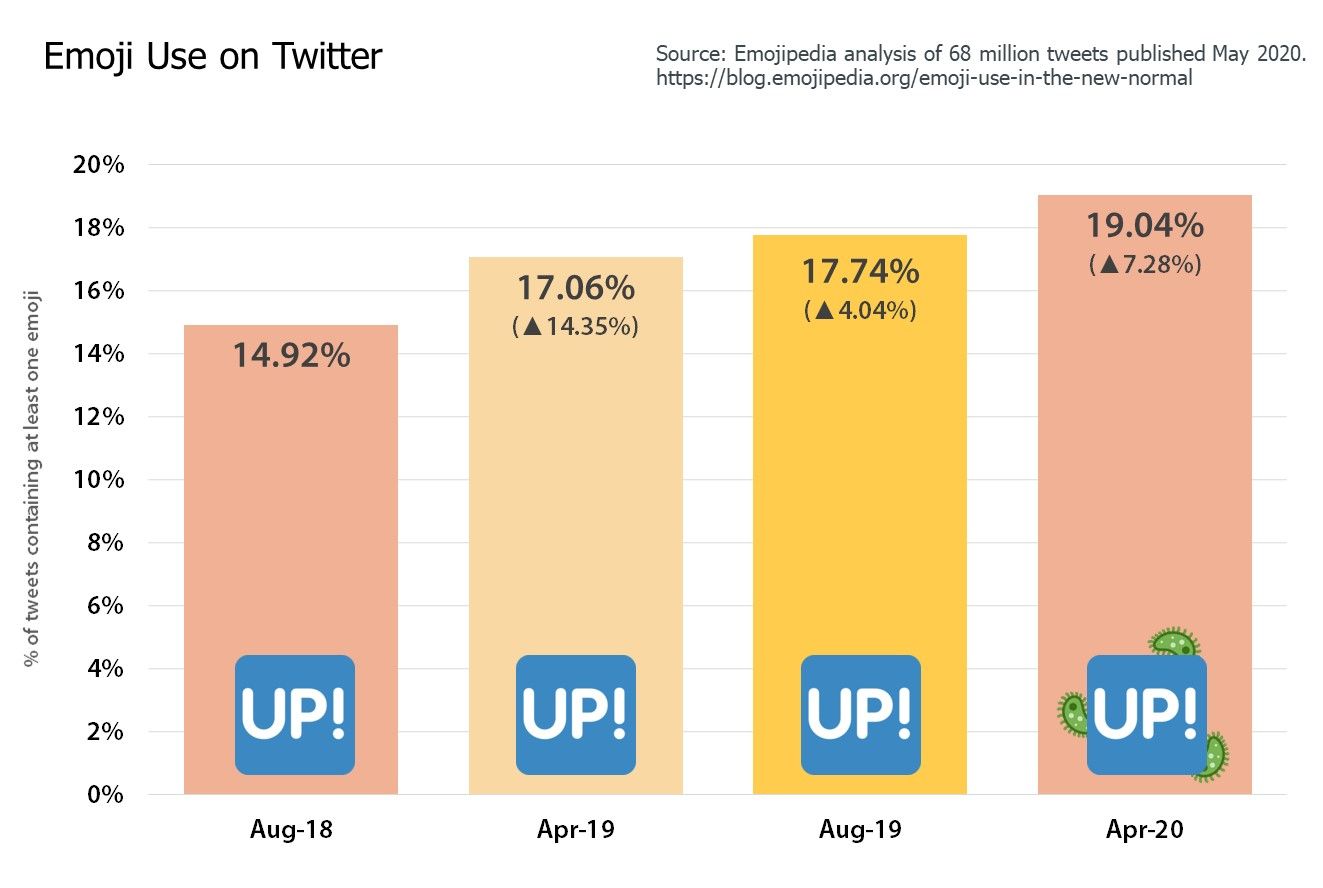
Emoji usage has increased from 17.74% of all tweets to 19.04% between August 2019 and April 2020 (a relative increase of 7.1%).
This follows an increase from 14.9% to 17% between August 2018 and April 2019, a relative increase of 14.1%. So while emoji use continues to grow, this is a trend that has been taking place for quite some time now.
A wider analysis of emoji growth trends would need to be conducted to make a more substantive claim about whether Coronavirus has impacted growth, either positively or negatively.
😃🐻🍔 Emoji Categories
Are the types of emojis we are sending changing, and if so: how?
Competing mobile phone and app platforms categorize emojis in different ways. Emojipedia lists emojis in these eight groups:
- 😃 Smileys & People
- 🐻 Animals & Nature
- 🍔 Food & Drink
- ⚽ Activity
- 🌇 Travel & Places
- 💡 Objects
- 🔣 Symbols (which include the various hearts)
- 🎌 Flags
When assessing the relative popularity of each group, smileys and people make up such a high percentage, it's difficult to even make out some of the lesser-used groups.
Shown below are the top three categories of 😃 Smileys & People, 🐻 Animals & Nature and 🔣 Symbols.
All other categories have been combined into a single group for legibility.
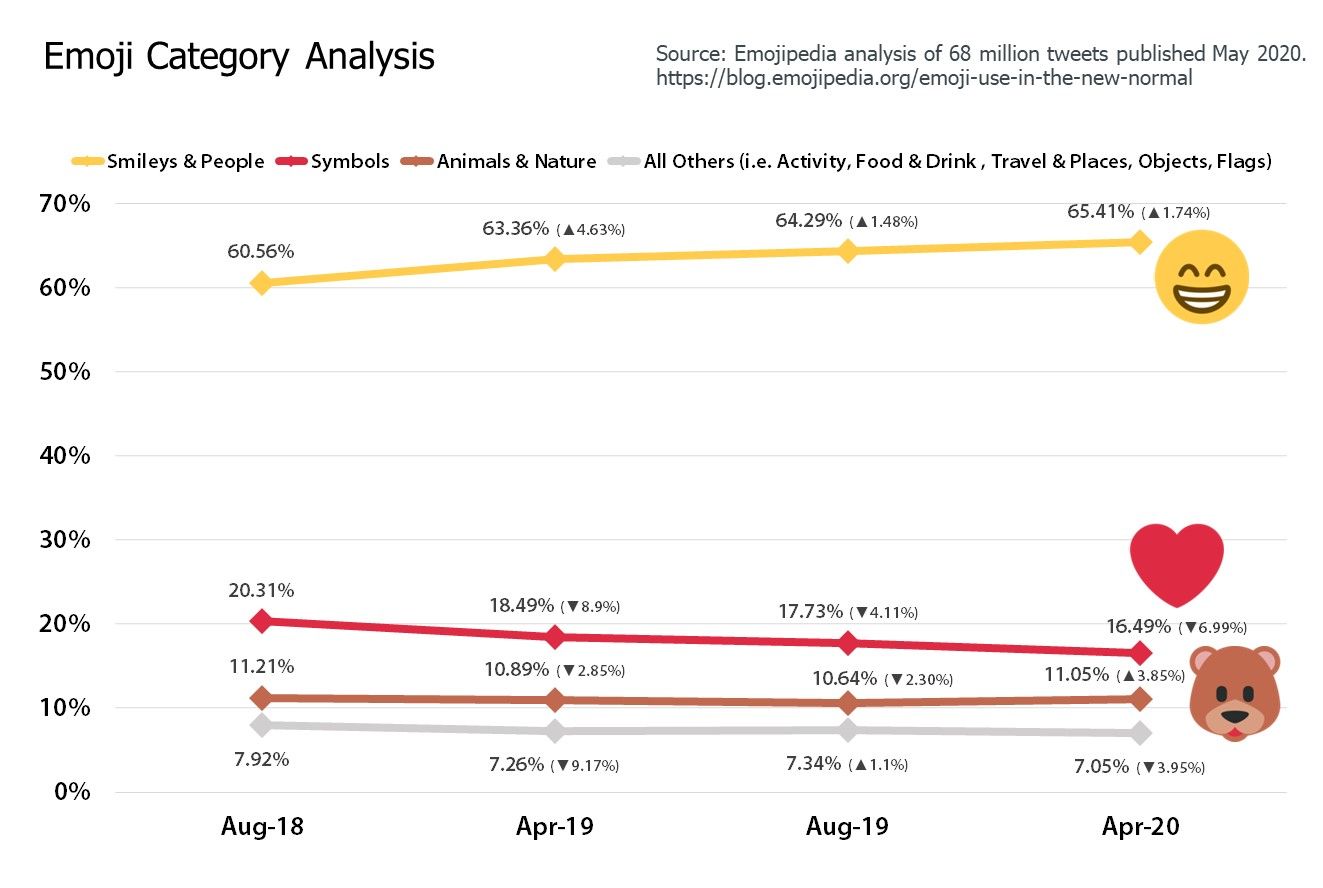
😃 Smileys & People assumes the lion's share of emoji instances, never dropping below 60%.
In distant second is the 🔣 Symbols category, which is dominanted by the various heart emojis. This is continues to trend down, possibly due to new smileys that include hearts.
Third place shows 🐻 Animals & Nature category, relatively stable.
All other categories collectively accounted for no more than 7.92% of all emoji use.
To better observe trends in the smaller categories, the top three categories have been removed from the chart below.
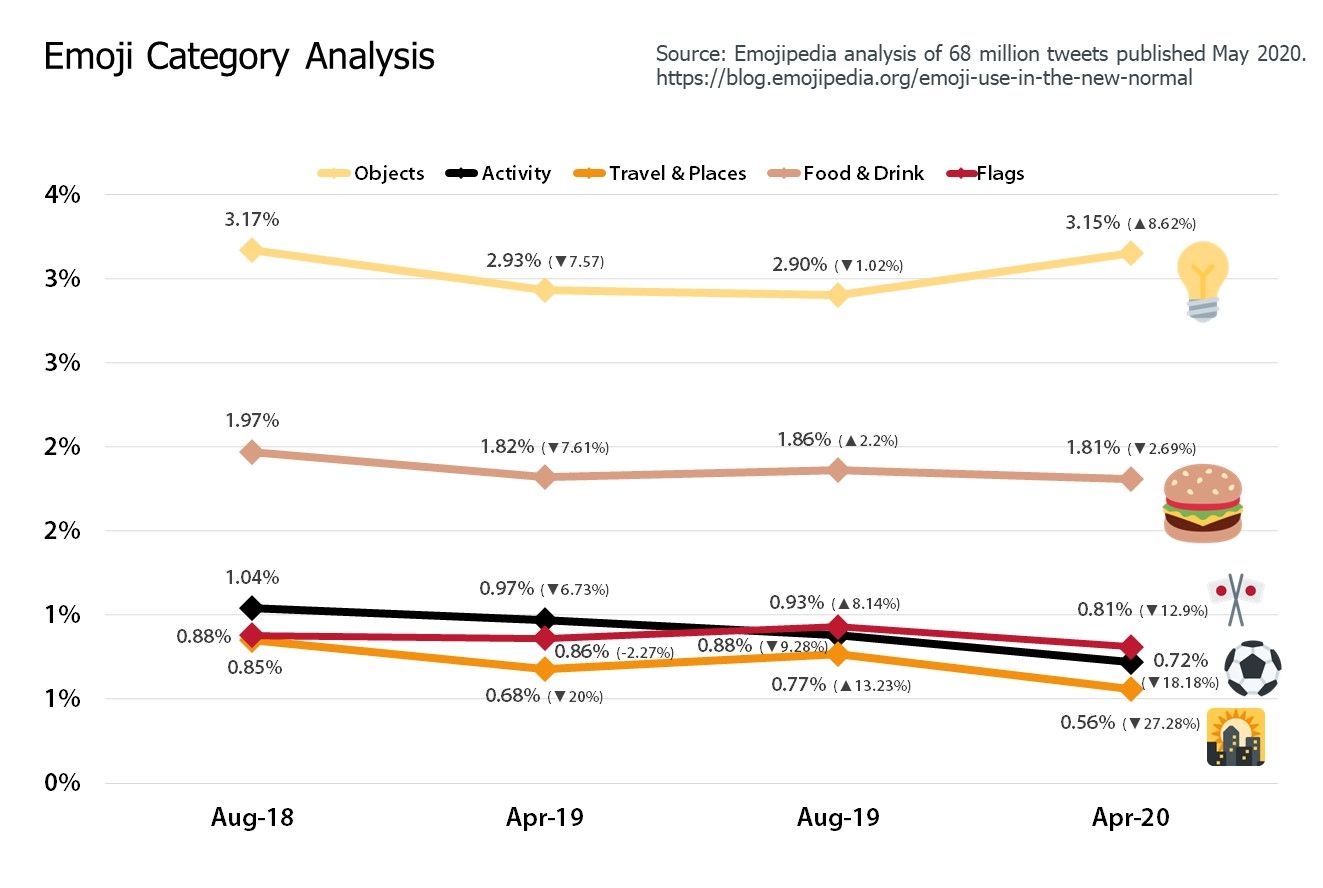
While the variations in these categories do largely appear to be following an expected pattern of ebb and flow, the relative decline of the 🌇 Travel & Places category of 27.28% between August 2019 and April 2020 seems initially interesting as a potential response to the travel restrictions of 2020 in many countries around the world.
However, one should also note the 20% decrease in this category between August 2018 and April 2019: could this be a seasonal effect for travel emojis between Summer and Spring in the northern hemisphere? A closer analysis would have to be taken to determine the month-by-month trends here.
What is shown is that this year's drop in travel-related emojis is more pronounced than the same decrease in 2018-2019.
🆕📈 Emoji Winners
Looking deep into the wider emoji set: which emojis saw large increases or decreases in their use of late?
Often the lesser-used emojis can be missed in charts of most popular emojis, but that doesn't mean there aren't trends to be found.
We peformed this analysis by assessing the relative increase in usage between August 2018 and April 2019, excluding any emoji that did not have over 1,000 instances of use in April 2020.[6]
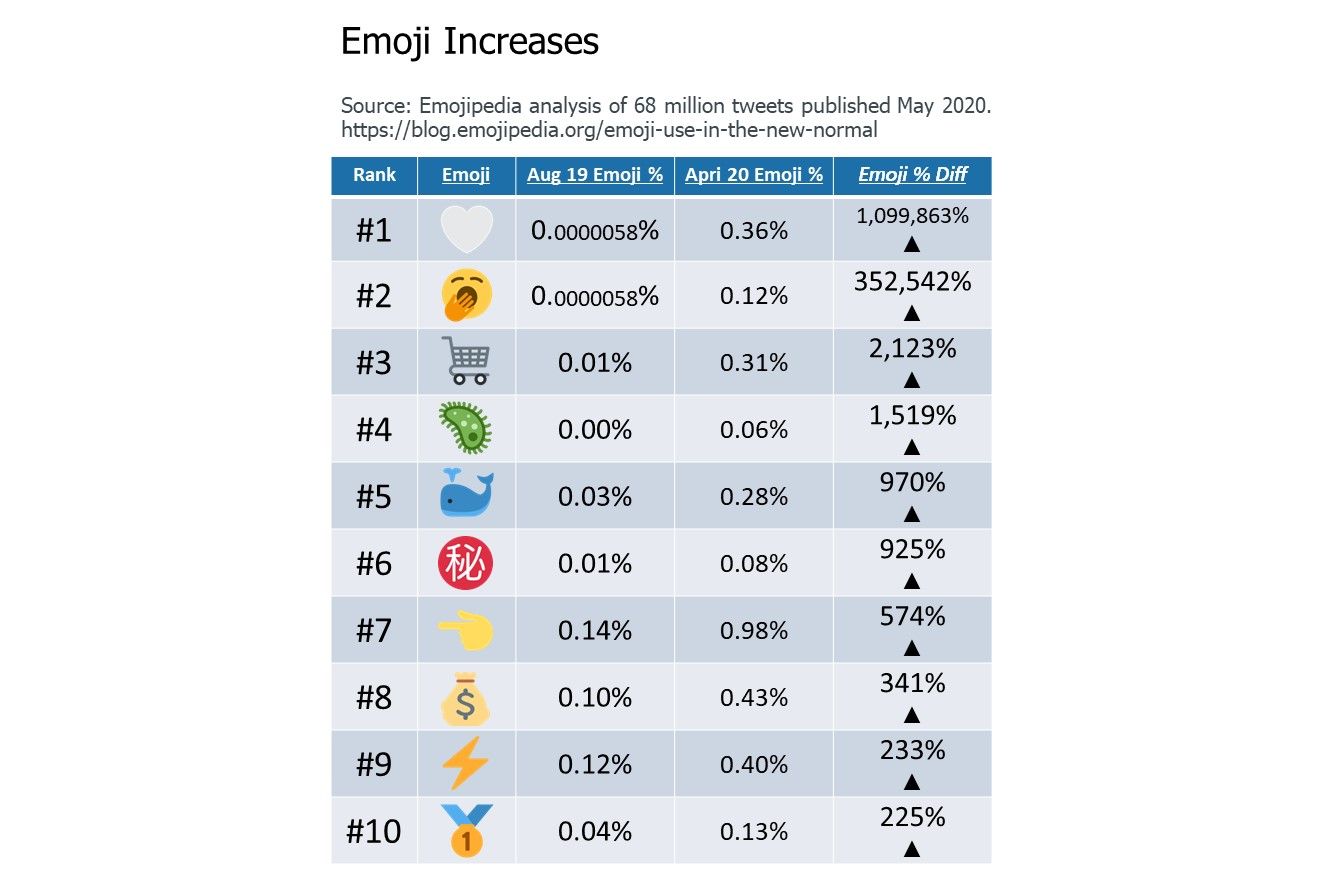
These are the emojis which saw the greatest relative increases in the past nine months:
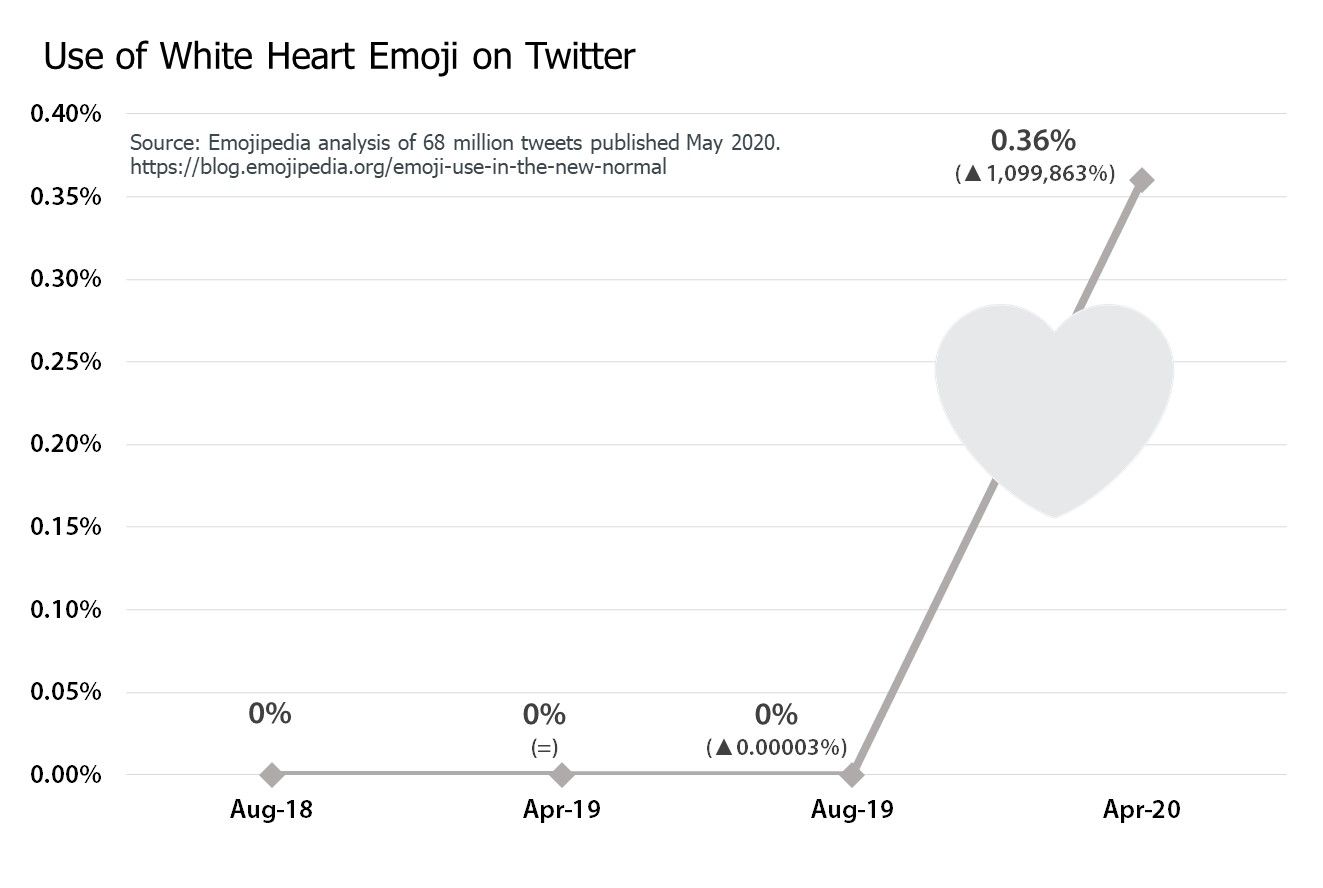
- 🤍 White Heart
- 🥱 Yawning Face
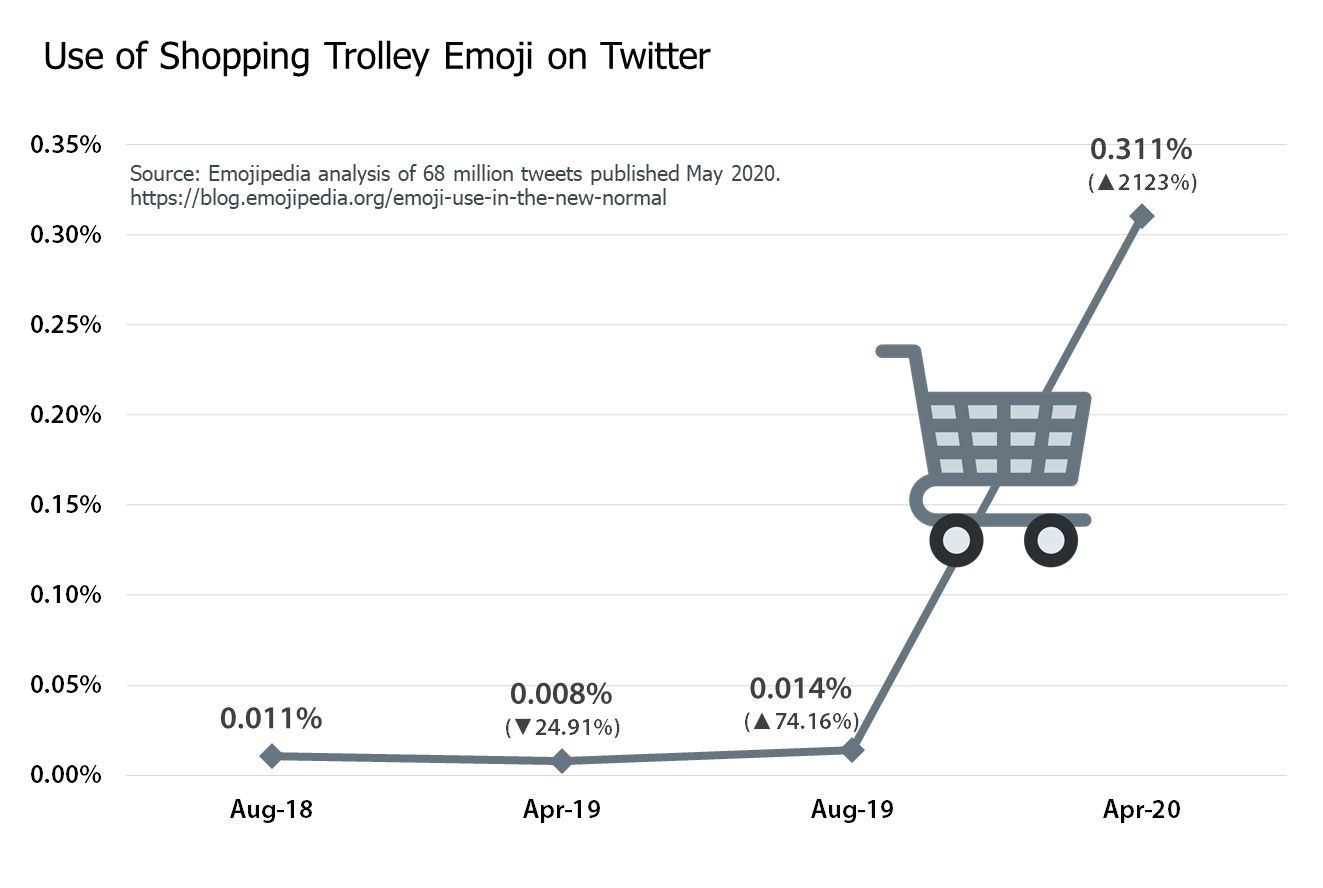
- 🛒 Shopping Cart
- 🦠 Microbe
- 🐳 Spouting Whale
- ㊙️ Japanese “Secret” Button
- 👈 Backhand Index Pointing Left
- 💰 Money Bag
- ⚡ High Voltage
- 🥇 1st Place Medal
Both 🤍 White Heart and 🥱 Yawning Face were introduced in 2019 via Emoji 12.0 and introduced to Twitter users on browsers in April 2019.
Despite this, its usage in August of 2019 was quite minor. However, following the introduction of both 🤍 White Heart and 🥱 Yawning Face to Samsung and Apple devices at the end of August and October respectively, these emojis experience a meteoric relative rise in usage in terms of their overall share of tweets featuring at least one emoji.
The increase in 🛒 Shopping Cart is of interest considering the widely-reported instances of crowded supermarkets that occurred across much of the world in the wake of the coronavirus outbreak.
Fourth in the list of emojis which have seen the most growth in this period is the 🦠 Microbe which appeared in our initial COVID-19 emoji analysis last month.
That analysis showed increases for both 🦠 Microbe and 😷 Face with Medical Mask, echoed here in this analysis. 😷 Face with Medical Mask was the #11 in the most significant increase seen on an individual emoji, so just missed the cut in this chart.
The relative change in use of each emoji is shown below.
🆕📉 Emoji Losers
Finally, which emojis are decreasing in popularity in recent times?
Looking at emojis with over 1,000 usage instances that experienced the largest relative decrease in use shows a mixed bunch.
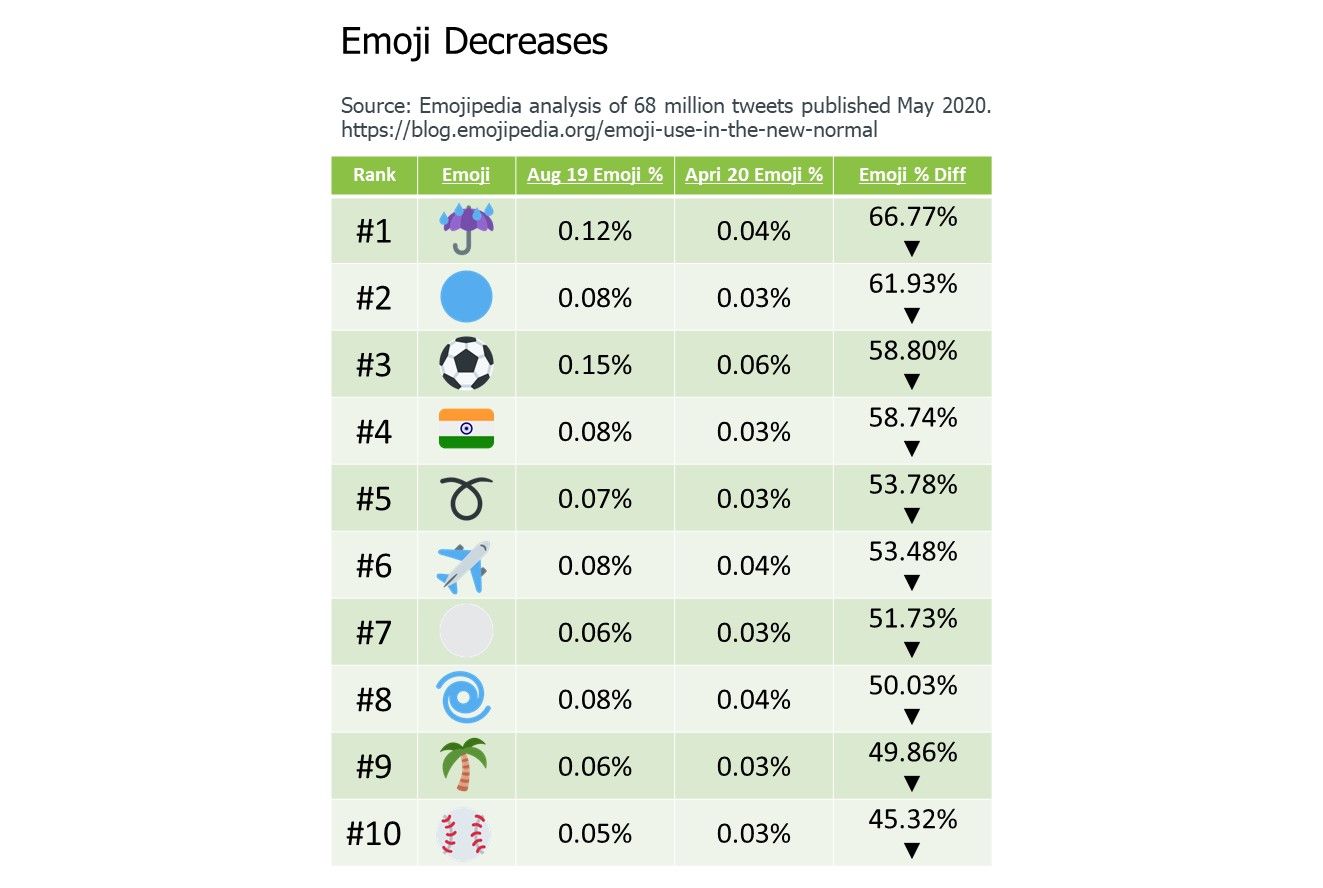
The emojis which dropped in use the most significantly from August 2019 to April 2020 are:
- ☔️ Umbrella with Rain Drops
- 🔵 Blue Circle
- ⚽ Soccer Ball
- 🇮🇳 Flag: India
- ➰ Curly Loop
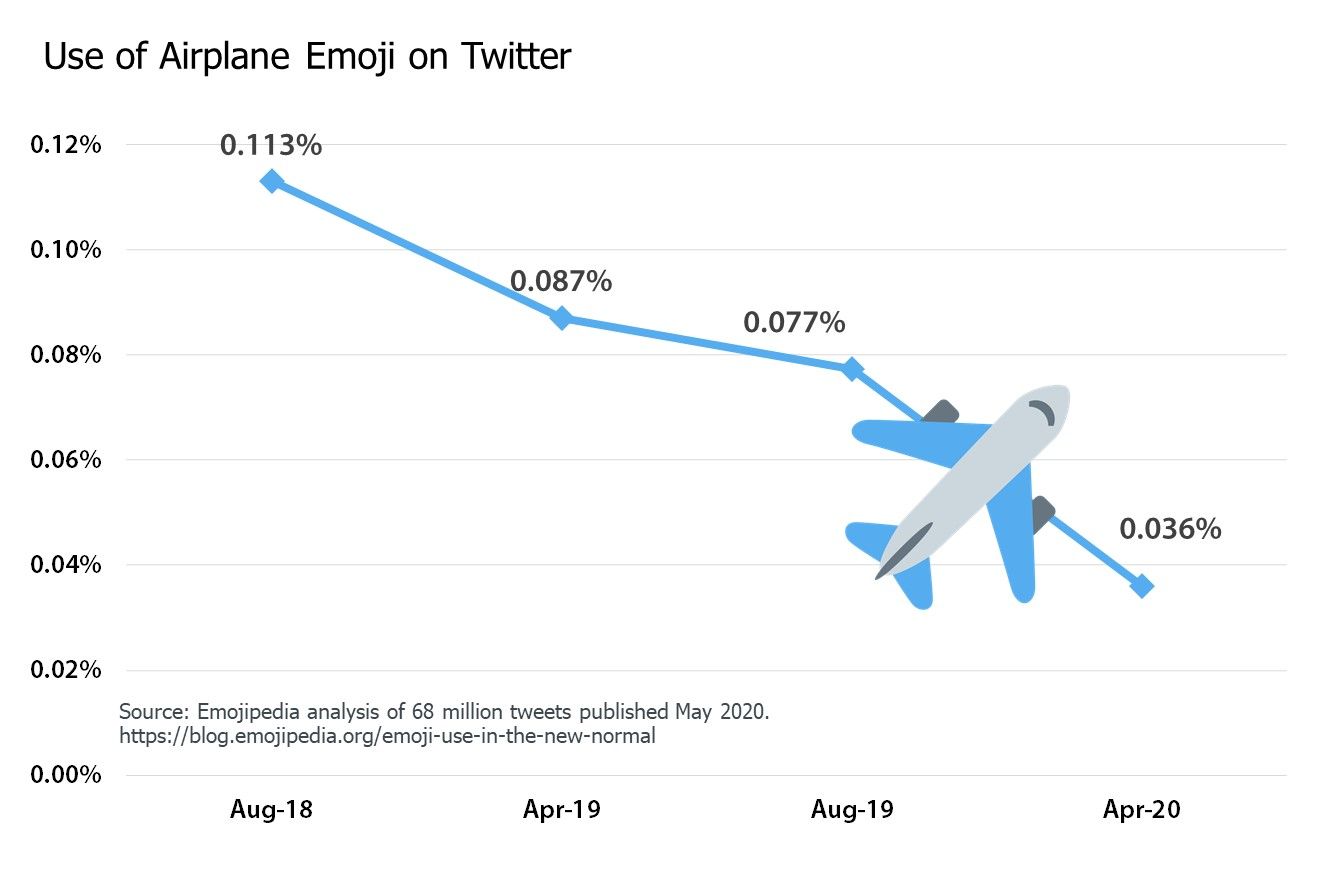
- ✈️ Airplane
- ⚪ White Circle
- 🌀 Cyclone
- 🌴 Palm Tree
- ⚾ Baseball
The reason for ☔️ Umbrella with Rain Drops or 🔵 Blue Circle losing so much ground is not clear, but the suspension of many professional sports in 2020 could be behind the dropping ⚽ Soccer Ball, ⚾ Baseball.
✈️ Airplane has seen its use halve in the period assessed, though some of that change will be due to seasonal factors noted in our category analysis.
🇮🇳 Flag: India dropping in use can be explained by Independence Day in India being held during one of the assessed periods, but not the other.
➰ Curly Loop would require additional analysis to determine if there were social campaigns or alternative uses of this emoji which may have led to its decline.
The relative change in use of each emoji is shown below.
🤓 Summary
Following an analysis of over 68 million tweets across four time periods in 2018, 2019 and 2020, we made the following findings:
- ☺️📉 The relative use of positive smiley face emojis is on the decline (down 5.63%).
- 🥺⏫ Pleading Face is experiencing surging popularity.
- 📊📈 The top ten emojis used on Twitter are relatively stable
- 🔝😂 Face with Tears of Joy remains the most used emoji on Twitter.
- 💕🆙 Emoji use as a whole continues to rise, with nearly one in five tweets now containing at least one emoji
- 🤔🦠 The increase in emoji use has been potentially slowed by our new normal, but its too soon to say this with certainty.
- 😃👍 Smileys & People still dominate in terms popular emoji categories, while 🔣 Symbols are on the decline.
- ✈️⤵️ Emojis in the Travel & Places category have seen larger than usual decreases recently, possibly due to travel restrictions.
As with any data, many of these figures can be read in different ways. It's clear in the real world that our new normal is continually changing.
If, how and when the changing planet affects our digital communications is something that remains interesting to watch. Whether we use our digital lives to reflect our real lives, or as an escape from them may also vary by individual, and social media platform.
The insights shared here are using Twitter data due to the public nature of the platform, so are inherently unable to determine whether private messaging conversations have seen similar shifts.
There are indications here that positive emoji use remains high despite the difficulties faced by many. Regardless of how you express yourself online, take care out there 💕
📖 Further Reading
- 🆕 117 New Emojis In Final List For 2020
- 🐢 What the 2021 Unicode Delay Means for Emoji Updates
- 📙 Emojipedia Lookups At All Time High
- 🥺 A New King: Pleading Face
- 😷 Spread of the Coronavirus Emoji
- 🦠 Coronavirus Emoji List
When we refer to an "instance" of emoji usage in our sample, we are referring to the number of tweets which featured any given individual emoji character (for example, of the 18,753,639 tweets analyzed in April 2020, 444,525 contained at least one 😂 Face with Tears of Joy. As of course a tweet can contain more than one emoji, the sum total number of emoji "instances" in each of our time periods is greater than the number of individual tweets that featured at least one emoji. For example, in April 2020 3,570,019 of the 18,753,639 tweets we collected containd at least one emoji (roughly 19%). However, across those 3,570,019 tweets a total of 5,177,992 individual emoji instances occured, with this figure being the sum of all tweets each individual emoji was featured within. Therefore when assessing the relative sentiment of smiley emojis the summed emoji instances is used instead of the total number of individual tweets featuring at least one emoji. ↩︎
Emoji polarity was divided as follows: "Positive" {😀😁😂😃😄😅😆😉😊😋😎😍😘😗😙😚☺️🤗😇😏😌😛😜😝🤑😈😸😹😺😻😼😽🤠🤣🤤🤩🤪🥳🥰}, "Negative" {🤔😐😑😶🙄😣😥😮🤐😯😪😫😴☹️🙁😒😓😔😕😖🙃😷🤒🤕😲😞😟😤😢😭😦😧😨😩😬😰😱😳😵😡😠👿👹💀☠️😾😿🙀🤢🤥🤧🤨🤬🤮}, and "Other/Ambiguous" {🤓🗣️👤👥👺👻👽👾🤖💩🤡🤫🤭🤯🧐🥴🥵🥶🥺🥱}. ↩︎
These four time periods were the 8th to the 17th of August 2018, April 2019, August 2019 and April 2020. August and April were selected at the months-of-interest for convenience for the following two reasons: this analysis was conducted in April of 2020 , and the most recent historic batch of tweets available via The Internet Archive’s Twitter Stream Grab at the time of writing was August 2019. Data from April 2020 was collected and cleaned by Emojipedia using RStudio. An exact total of 68,157,582 tweets from across the globe were assessed. ↩︎
Honourable mention to 😔 Pensive Face, which did not crack the top ten during any of our time frames but was ranked 11th in our April 2020 sample after a 35% increase in usage since August 2019. Another potential byproduct of the coronavirus? ↩︎
As we were counting the appearance of each invidual emoji as opposed to a grouping of emojis, we opted for the relative percentage of tweets featuring at least one emoji as opposed to the sum of emoji instances used in our smiley emoji sentiment analysis. ↩︎
This was done to avoid mapping relative variations in use of extremely uncommon emojis, where an increase from 10 uses to 30 uses would be an increase of 200% despite being a small jump in actual usage. ↩︎